
Building a Biological Incubator Environmental Monitoring System with Zeek
When I first started learning Zeek, I mainly thought of it as a network security monitoring framework: inspect traffic, extract useful information, generate logs, and detect suspicious activity. But while experimenting with Zeek scripting, I became interested in a different question: Can Zeek’s scripting and logging capabilities be used to monitor IoT-style telemetry, even when the data itself is not traditional network-security data?
That question led me to build a small incubator environmental monitoring and alert system using Zeek. The project simulates sensor telemetry for an incubator environment and uses Zeek scripts to evaluate the readings against predefined thresholds. The system records the results in a custom Zeek log and demonstrates normal, critical, and recovery conditions. This is not a production medical or laboratory monitoring system. The sensor values are simulated and are used only to demonstrate how Zeek can process structured telemetry and how several Zeek scripts can work together as a small monitoring workflow.
What I Wanted to Build
The goal was fairly simple:
- Generate simulated incubator telemetry.
- Feed that telemetry into a Zeek-based monitoring workflow.
- Check sensor values against predefined thresholds.
- Record the results in a custom Zeek log.
- Generate alerts when multiple parameters become critical.
- Test normal, failure, and recovery scenarios.
- Replay the captured traffic through Zeek using PCAP files.
The project therefore sits somewhere between network monitoring, IoT telemetry processing, and event-driven monitoring. The important part for me was not creating a complicated application. I wanted to understand how Zeek’s scripting model could be broken into small, reusable pieces.
System Overview
The basic workflow looks like this:
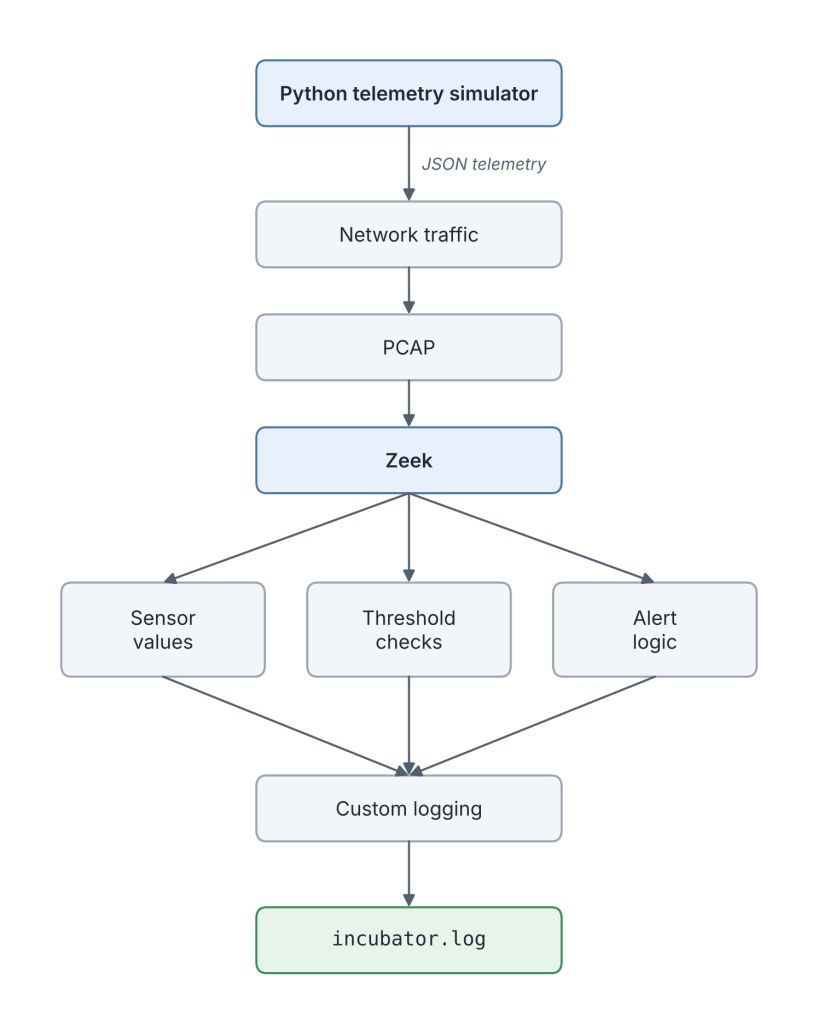
The Python simulator generates the telemetry, while the Zeek scripts handle the monitoring logic. This separation was intentional. The simulator is responsible for producing data. Zeek is responsible for processing and recording that data.
What the System Monitors
The simulated incubator telemetry contains four environmental parameters:
| Parameter | Example value | Unit |
|---|---|---|
| Temperature | 37.0 | °C |
| CO₂ | 5.0 | % |
| Humidity | 95.0 | % |
| Oxygen | 20.0 | % |
These values are simulated project data. They should not be interpreted as validated clinical, laboratory, or production incubator limits. The purpose of the values is to provide predictable test cases for the Zeek monitoring logic.
The Zeek Scripts
sensor_input.zeek
This script provides the simulated sensor values used during testing. For example:
temperature_value = 37.0;co2_value = 5.0;humidity_value = 95.0;oxygen_value = 20.0;
Keeping the test values in their own script made it easy to change the input conditions without modifying the rest of the monitoring logic. For example, I could change the temperature and CO₂ values to simulate a failure scenario while leaving the threshold and logging code unchanged.
thresholds.zeek
This script contains the threshold-checking logic. Each sensor reading is evaluated against its configured range and produces a status. Conceptually:
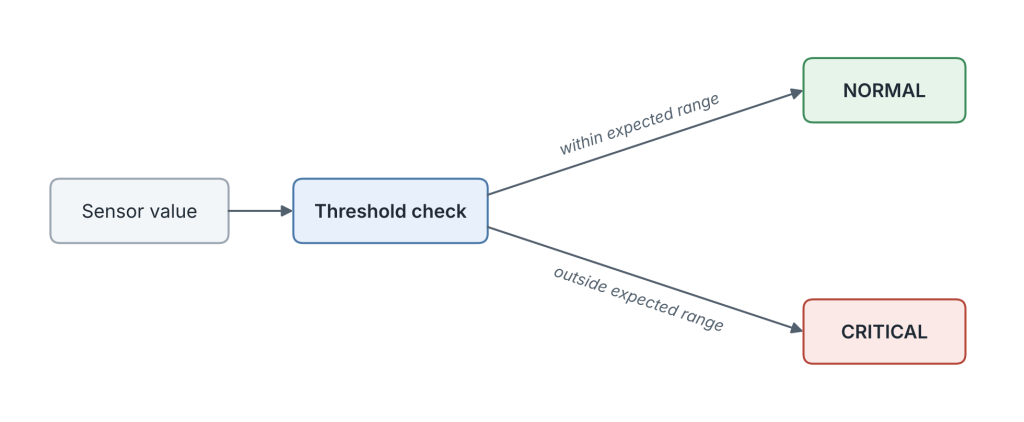
The important point here is that the threshold logic is kept separate from the input data. That makes the project easier to extend later because the sensor values and the decision logic are not tightly coupled.
alerts.zeek
The alert script receives the results from the individual sensor checks. It counts how many parameters are currently marked CRITICAL.
The project demonstrates three basic conditions:
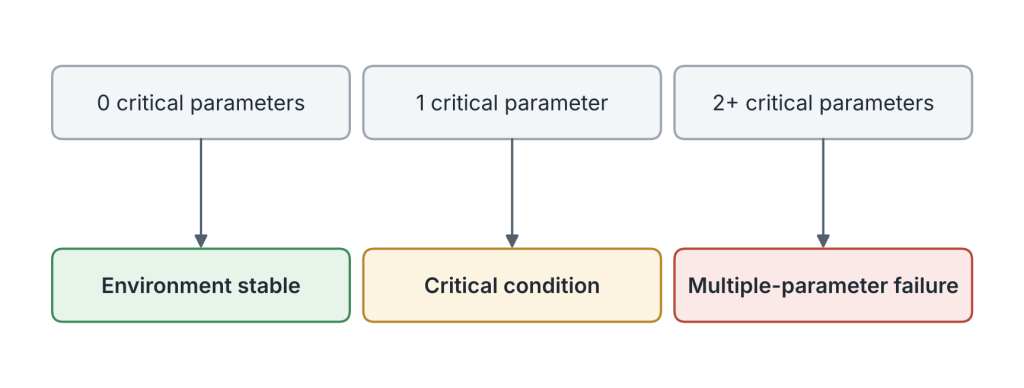
The multiple-parameter condition is particularly useful for demonstrating that the alerting logic can consider several telemetry fields together rather than treating every sensor reading as an independent event.
logging.zeek
One of the main goals of the project was to create a custom Zeek log. The monitoring information is written to incubator.log.
The log contains fields representing information such as:
ts sensor value units status
A simplified example looks like:
0.000000 temperature 37.0 C NORMAL0.000000 co2 5.0 % NORMAL
This is one of the areas where Zeek becomes particularly useful for this type of experiment. Instead of simply printing information to the terminal, the monitoring results become structured log data that can be inspected and processed later.
alert_logging.zeek
This script provides logging support for alert-related information. Keeping alert logging separate from the general telemetry logging makes it possible to distinguish between: “What did the system observe?” and “What did the monitoring logic consider important?”.
That distinction becomes increasingly useful as the project grows.
incubator_telemetry.zeek
This script handles the telemetry-related part of the Zeek workflow. It provides the connection between the telemetry data and the monitoring logic. The intention is to keep the telemetry handling separate from the threshold and alert decisions.
main.zeek
The main script acts as the workflow coordinator. At a high level:
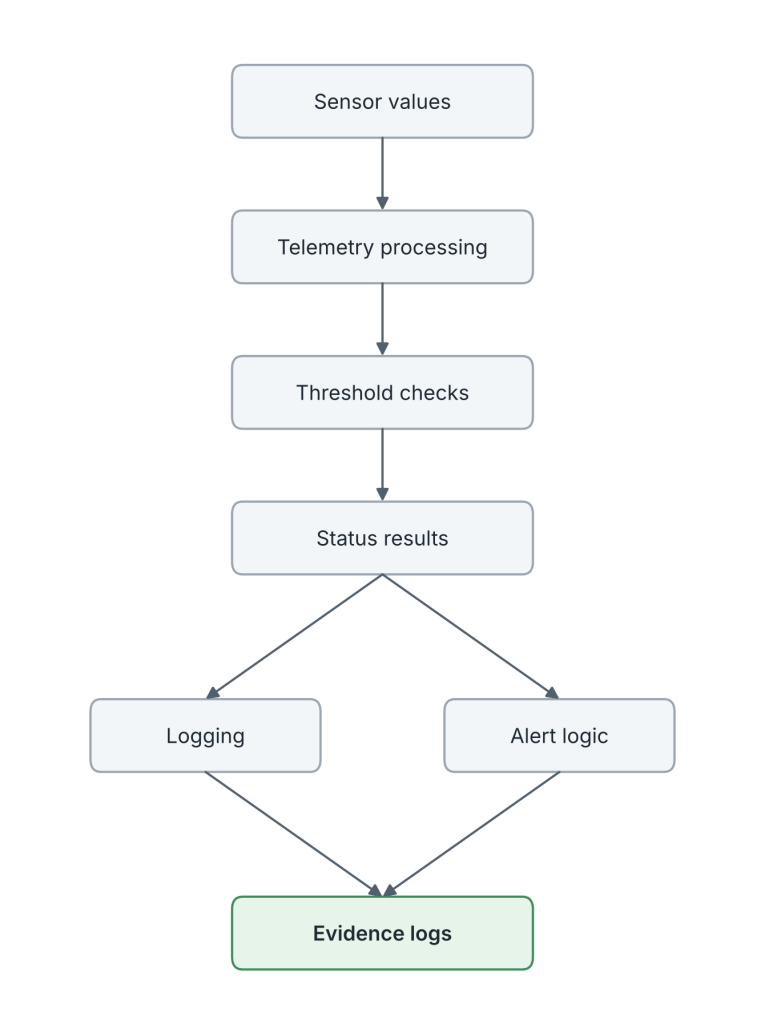
This was an important learning point for me. Rather than thinking of the project as one large Zeek script, I started thinking about it as several small pieces that each perform one job.
Loading the Scripts Together
The __load__.zeek file provides the entry point for the script directory. The individual components are loaded together:
@load ./logging@load ./thresholds@load ./alert_logging@load ./alerts@load ./sensor_input@load ./incubator_telemetry@load ./main
This allows the complete monitoring workflow to be loaded by specifying the directory, incubator, instead of manually specifying every individual script. This also gave me a better understanding of how Zeek script packages can be organized into smaller components.
Telemetry Simulation
The project includes a small Python-based telemetry simulator. The repository contains:
telemetry_simulator/├── incubator_sender.py└── telemetry_receiver.py
The simulator allows the project to operate without physical sensors. That makes the testing process repeatable. For example, I can deliberately generate normal telemetry, then critical telemetry, then normal telemetry again, and then use the resulting captures to test the monitoring workflow.
Why Use PCAP Files?
One of the useful things about this approach is that I don’t need to run the telemetry simulator every time I want to test the Zeek scripts. Once the telemetry has been captured, the traffic can be replayed through Zeek. The project includes incubator_payload.pcap and incubator_normal.pcap. This gives me a reproducible test environment. Instead of saying, “The script worked when I ran it,” I can provide the capture and say, “Here is the same traffic that was used for the test, and here is how Zeek processed it.” That makes debugging and experimentation much easier.
Running Zeek Against the PCAP
From the project root, the included capture can be processed with:
zeek -C -r incubator_payload.pcap incubator
Here:
-Callows Zeek to ignore checksum errors that can occur in captured or replayed traffic.-r incubator_payload.pcaptells Zeek to read packets from the PCAP file.incubatorspecifies the directory containing the Zeek scripts.
The PCAP files (incubator_normal.pcap and incubator_payload.pcap) contain TCP packets on the loopback interface (127.0.0.1) sent to port 9000. These packets do not include the JSON telemetry payload itself (the TCP segments have length 0). The actual sensor values used in the monitoring workflow come from the Zeek script sensor_input.zeek, which provides the temperature, CO₂, humidity, and oxygen values for testing.
In this project, the PCAP files serve as reproducible triggers for the Zeek monitoring pipeline, allowing the full incubator workflow (telemetry processing, threshold checks, alerts, and logging) to run deterministically even though the sensor values themselves come from the Zeek scripts rather than the captured packets.
After processing the capture, the generated log files can be inspected with:
ls -lh *.logcat incubator.log
Test 1: Normal Operation
The first test represents normal environmental conditions. The simulated values were:
| Parameter | Value |
|---|---|
| Temperature | 37.0 °C |
| CO₂ | 5.0 % |
| Humidity | 95.0 % |
| Oxygen | 20.0 % |
The monitoring result was:
Incubator environment stableTemperature 37.0 C Status NORMALCO2 5.0 % Status NORMALHumidity 95.0 % Status NORMALOxygen 20.0 % Status NORMAL
The corresponding evidence is stored in phase14_final_evidence/normal_after_cleanup.log and can be viewed with cat phase14_final_evidence/normal_after_cleanup.log.
This test establishes the baseline behavior of the system.
Test 2: Failure Condition
For the failure test, I deliberately changed two of the simulated values:
| Parameter | Value |
|---|---|
| Temperature | 37.8 °C |
| CO₂ | 6.8 % |
| Humidity | 95.0 % |
| Oxygen | 20.0 % |
The resulting status was:
Temperature 37.8 C Status CRITICALCO2 6.8 % Status CRITICALHumidity 95.0 % Status NORMALOxygen 20.0 % Status NORMAL
The important part of this test is that the system did not simply mark the entire environment as failed. It identified the individual parameters:
| Parameter | Status |
|---|---|
| Temperature | CRITICAL |
| CO₂ | CRITICAL |
| Humidity | NORMAL |
| Oxygen | NORMAL |
The alert logic could then identify that multiple monitored parameters were simultaneously critical.
The evidence is stored in phase14_final_evidence/failure_after_cleanup.log and can be viewed with cat phase14_final_evidence/failure_after_cleanup.log.
Test 3: Recovery
After the failure test, I restored the simulated values to the normal state:
| Parameter | Value |
|---|---|
| Temperature | 37.0 °C |
| CO₂ | 5.0 % |
| Humidity | 95.0 % |
| Oxygen | 20.0 % |
The system returned to:
Incubator environment stableTemperature 37.0 C Status NORMALCO2 5.0 % Status NORMALHumidity 95.0 % Status NORMALOxygen 20.0 % Status NORMAL
The recovery evidence is stored in phase14_final_evidence/final_recovery_normal.log and can be viewed with cat phase14_final_evidence/final_recovery_normal.log.
The recovery test is useful because it demonstrates that the monitoring logic is not permanently stuck in an alert state after a failure condition. The sequence becomes:
NORMAL → CRITICAL → NORMAL
This gives the project a simple but complete monitoring lifecycle.
Reviewing All Evidence
The three final evidence files can be inspected together:
cd incubator-monitoringls -lh phase14_final_evidencecat phase14_final_evidence/normal_after_cleanup.logcat phase14_final_evidence/failure_after_cleanup.logcat phase14_final_evidence/final_recovery_normal.log
Together, these files provide a reproducible record of normal operation, a failure condition, and recovery.
What I Learned About Zeek
The biggest lesson from this project was that Zeek does not have to be used only for the traditional “network attack detection” examples that are often used when first learning it.
Zeek provides a useful combination of:
- Event-driven scripting
- Protocol and connection visibility
- Structured logging
- Stateful analysis
- Custom data types and records
- Modular script loading
- Detection and notification mechanisms
That makes it possible to experiment with monitoring applications that generate network telemetry. In this project, I used those capabilities to build a small monitoring workflow around simulated incubator data.
Why I Kept the Scripts Modular
One of the main goals of the project was to avoid creating a single large Zeek script. Instead, I separated the functionality into:
sensor_input.zeekincubator_telemetry.zeekthresholds.zeekalerts.zeeklogging.zeekalert_logging.zeek
The advantage is mostly educational at this stage. Each component has a clear responsibility, which makes it easier to modify and test. For example, I can change the simulated sensor values without changing the alert logic. I can change the threshold logic without rewriting the logging code. And I can change the log structure without changing how the input values are generated. This modular approach also gives me a foundation for experimenting with more realistic telemetry in the future.
Project Limitations
There are some important limitations. This project is a learning and demonstration project. It does not:
- Connect to physical incubator sensors
- Provide validated medical or laboratory safety thresholds
- Replace a certified monitoring system
- Provide clinical decision support
- Guarantee real-time environmental safety
- Detect real-world medical emergencies
The sensor values are synthetic, and the thresholds are configured solely for demonstrating the Zeek workflow. The project should therefore be viewed as an experiment in telemetry monitoring using Zeek, rather than a production monitoring solution.
What Comes Next
This project started as a simple experiment: Can I use Zeek scripts to monitor structured sensor telemetry? The answer was yes. More importantly, the experiment helped me understand Zeek from a different perspective.
The next step for me is to take the same approach into a more security-focused environment, for example network-connected ECG telemetry, where the goal would not be to determine whether an ECG reading is medically normal, but to investigate whether the telemetry system itself is being subjected to cyber threats such as replay, spoofing, protocol abuse, or unauthorized access. That would bring the project back closer to Zeek’s core security-monitoring strengths while keeping the telemetry domain interesting.
Technologies Used
- Zeek
- Python
- JSON telemetry
- PCAP packet captures
- Ubuntu Linux
Code and License
The full project is on GitHub: Incubator Environmental Monitoring and Alert System Using Zeek. It is licensed under the Apache License 2.0.